|
Monitoring Citrix Provisioning Services cache in RAM utilization
Within Citrix Provisioning Services, there are different destinations for the PVS Write Cache. • On device Hard drive • In device RAM • On a server • On a server persistent With the release of Citrix Provisioning Services 7.x, a new PVS cache destination was introduced: the cache can now be placed in RAM with overflow to disk.
This write cache method implies that changes are written in RAM memory, which is extremely performing. The target device write cache is written to RAM first. When RAM is full, the least recently used block of data is written to the local differencing disk (using VHDX differencing technology) to accommodate newer data on RAM. The amount of RAM specified is the non-paged kernel memory that the target device will consume.
Advantages of putting PVS Cache in RAM
We implemented this at a customer who needed very high performance on different applications.
With the introduction of the write cache to RAM we measured the following performance gains: · Faster logon times · Excel performance boost (measured more than 20% performance gain) · Overall performance boost (faster start and usage of applications) An additional advantage is that RAM memory is less expensive than high-end storage. Monitoring RAM utilisation
It is important to monitor RAM utilization (which data is written in the PVS Cache?), as well as the size of the overflow disk. From an availability point of view, the most important aspect is monitoring the overflow disk. When the overflow disk runs out of disk space, you will get a BSOD on the XenApp server, resulting in many users losing their session, applications and potentially any open documents.
Furthermore, when you start using the overflow disk, a performance drop can be noticed by the users.
PowerShell Scripts
To measure all of this and some other interesting settings of your farm we use a PowerShell script.
For the basic script we based us on the script from Phil Eddies (http://www.geekshangout.com/content/citrix-xenapp-health-monitor);
A few of the very interesting things about this script are: · You can let it run in a loop. It constantly checks your servers · It is very easy to adjust to your own environment · It is very easy to add or remove checks · Basic health check of your XenApp farm · You can add non-XenApp servers for some basic tests · ...
Firstly we added some extra PowerShell code to check for the disk space of C and D drives of the individual XenApp servers.
# Get free Disk space of the Server $DiskSpaceC = $disk = Get-WmiObject -class Win32_LogicalDisk -computername $Server -filter "DeviceID='C:'"
$freepercentC = $disk.freespace / $disk.size * 100 $DiskSpaceD = $disk = Get-WmiObject -class Win32_LogicalDisk -computername $Server -filter "DeviceID='D:'"
$freepercentD = $disk.freespace / $disk.size * 100 The PowerShell code we used to check the size of the overflow cache file:
# Relative path to the PVS vDisk write cache file and the size in Mb $PvsWriteCache = "\\$server\d$\vdiskdif.vhdx" if (test-path \\$Server\c$\Personality.ini) { $PvsWriteCacheUNC = Join-Path "\\$Server" $PvsWriteCache $CacheDiskMB = (Get-item $PvsWriteCache).length/1MB } $Cachedisk = 0 $VDISKImage = get-content \\$Server\c$\Personality.ini | Select-String "Diskname" | Out-String | % { $_.substring(12)} This results in the following example:
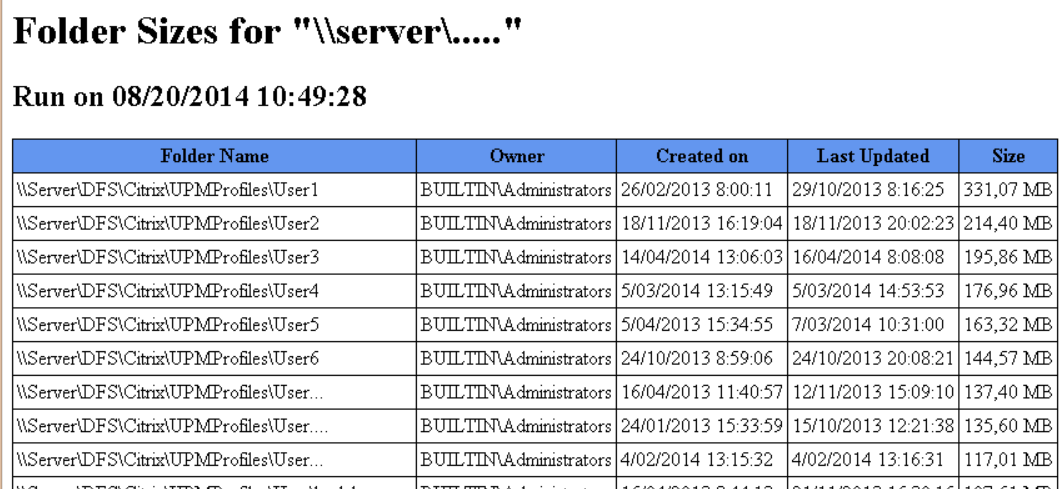
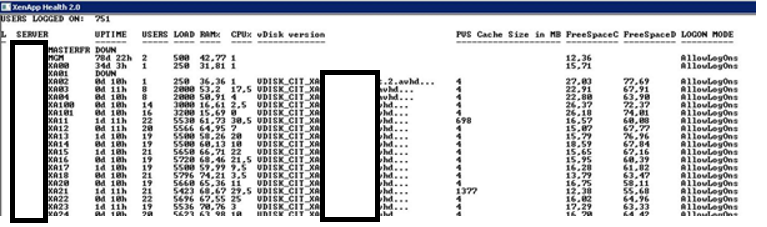 As you can see from the screenshot above, the PVS Cache file always has a minimum size of 4MB. Those are the headers of the file. We noticed at this customer, some servers filling up the Cache in RAM and using the overflow to disk. After some troubleshooting we found out that some applications were filling up certain subfolders in the user profiles There are some good PowerShell scripts to check the size of all your profiles at once: http://blogs.technet.com/b/heyscriptingguy/archive/2013/01/05/weekend-scripter-sorting-folders-by-size.aspx Resulting in this example:
 SUMMARY
We are convinced that putting the PVS Cache in RAM makes a lot of sense, and can substantially improve the performance of the XenApp servers. On the other hand, it is of key importance to closely monitor the behavior of the PVS cache, and to investigate which data could fill up the write cache in your environment, such as for example: o User profiles o Antivirus definitions, most Antivirus definitions have one active and one rollback pattern. (We noticed for some Antivirus vendors a few gigabyte of pattern files.) o Applications writing temporary files o Non-cached APP-V Package o .... Test everything if possible in an Acceptation environment and try to reboot your XenApp servers every few days. This will clear your memory and your write cache overflow to disk. Scaling your cache size in RAM is very important. And remember, the numbers tell the tale!
|